
RENTAL PROPERTY KPI DASHBOARD – COMPLETE SEO ARTICLE
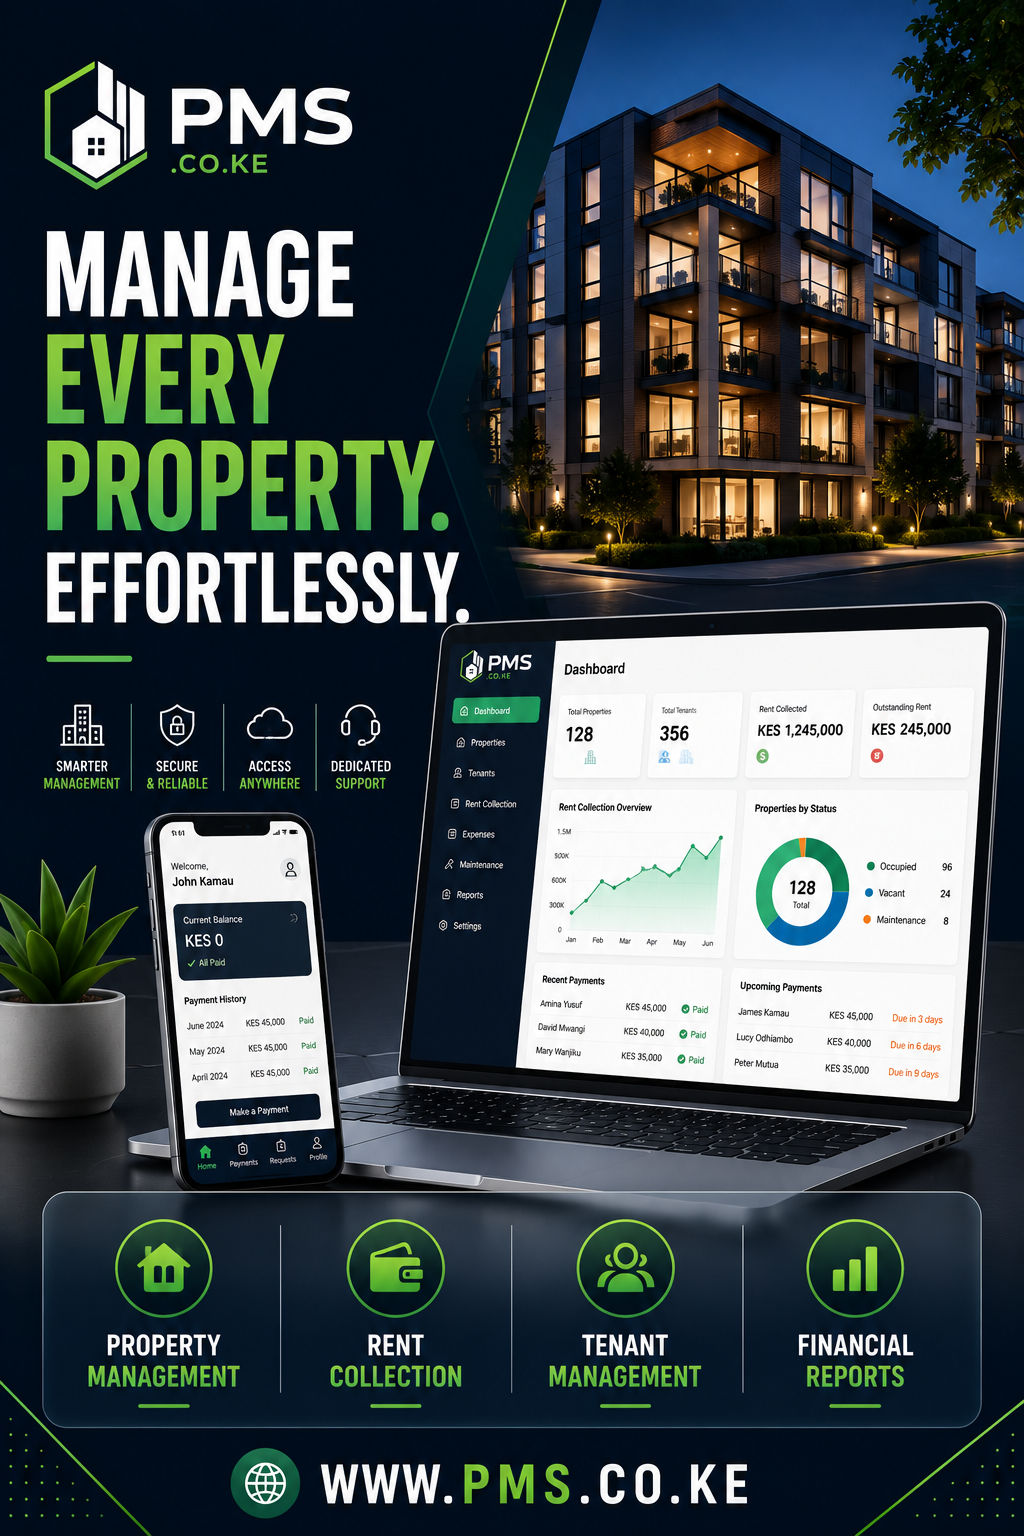
The Complete Guide to Using a Rental Property KPI Dashboard
In the competitive Kenyan property rental market, successful property managers and landlords rely on accurate, real-time data to make informed decisions. A Rental Property KPI Dashboard has become an essential tool for those seeking to maximize their return on investment while maintaining operational efficiency across multiple properties. Whether you manage a single residential unit or oversee dozens of commercial properties, understanding how to leverage a Rental Property KPI Dashboard can transform your property management approach from reactive to proactive.
The property rental landscape in Kenya has evolved significantly over the past decade. Property managers now face increasing demands from tenants for responsive service, regulatory compliance requirements, and pressure to optimize every aspect of their operations. This is where a comprehensive Rental Property KPI Dashboard becomes invaluable. It consolidates critical performance indicators into a single, accessible platform that provides immediate visibility into your property portfolio’s health.
This guide explores everything you need to know about implementing and utilizing a Rental Property KPI Dashboard in your property management operations. We’ll examine the key metrics you should monitor, discuss how to interpret dashboard data effectively, and provide practical strategies for using these insights to improve your bottom line.
Table of Contents
- Understanding Key Performance Indicators in Property Management
- Essential Metrics Every Property Manager Must Track
- How Technology Streamlines Performance Monitoring
- Maximizing Profitability Through Dashboard Insights
- Benefits for Property Managers and Landlords
- Improving Efficiency Through Automation and Analytics
- Compliance, Security and Risk Management
- Why RentalDesk’s Rental Property KPI Dashboard is the Ideal Solution
- Future Trends in Property Management Analytics
- Getting Started with Your Rental Property KPI Dashboard
PART 1: FOUNDATIONS AND STRATEGIC INSIGHTS
Understanding Key Performance Indicators in Property Management
A Rental Property KPI Dashboard is fundamentally a business intelligence tool designed to present performance metrics in a visual, easy-to-understand format. For property professionals in Kenya, this dashboard becomes the control center for monitoring everything from tenant satisfaction to financial performance. The term ‘KPI’ stands for Key Performance Indicator—these are the measurable values that show how effectively you’re achieving business objectives.
The significance of implementing a Rental Property KPI Dashboard extends beyond mere data collection. It represents a fundamental shift in how property managers approach their work. Rather than relying on intuition, memory, or scattered spreadsheets, a modern dashboard provides objective, real-time insights that guide strategic decisions. In Nairobi, Mombasa, and other major Kenyan cities where the property market has become increasingly competitive, this technological advantage can mean the difference between thriving and merely surviving.
Consider the typical property manager operating without a Rental Property KPI Dashboard. They might rely on phone calls to check occupancy rates, manually calculating rental income from invoices and receipts, and struggling to identify maintenance trends across properties. This approach is not only inefficient but also prone to errors that can cost thousands of shillings. In contrast, a property manager with access to a comprehensive Rental Property KPI Dashboard has instant access to all critical information, allowing them to identify issues before they become problems and capitalize on opportunities in real time.
The dashboard functions as a bridge between raw operational data and actionable business intelligence. Every interaction within your property—from tenant payments to maintenance requests—generates data. A Rental Property KPI Dashboard transforms this data into visual representations that make patterns immediately apparent. Whether you’re analyzing seasonal vacancy trends or identifying which properties require additional maintenance investment, the dashboard provides the perspective needed for informed decision-making.
Essential Metrics Every Property Manager Must Track
The power of a Rental Property KPI Dashboard lies in its ability to track metrics that directly impact your bottom line. The first essential metric is occupancy rate—the percentage of available units that are currently rented. This fundamental measure reveals your property’s income-generating capacity. A well-functioning Rental Property KPI Dashboard displays occupancy rates both in aggregate across your portfolio and on a per-property basis, allowing you to identify underperforming assets quickly.
Rental income and collection efficiency are equally critical. Your Rental Property KPI Dashboard should track not just how much rent is due, but how much is actually collected and when. In the Kenyan market, where late payments can cascade into operational difficulties, understanding collection trends is essential. Some advanced dashboards even predict payment delays based on historical patterns, giving managers time to intervene before cash flow problems develop. This predictive capability transforms a Rental Property KPI Dashboard from a historical reporting tool into a strategic planning instrument.
Maintenance costs and response times deserve prominent placement in any Rental Property KPI Dashboard. These metrics reveal your operational efficiency and directly impact tenant satisfaction. When your dashboard shows that average maintenance response times exceed industry standards, or that maintenance costs are escalating, you have the data needed to implement improvements. Some properties might benefit from preventive maintenance programs that reduce emergency calls, while others might require vendor negotiations to control costs. Without this insight from your Rental Property KPI Dashboard, these opportunities remain hidden.
Tenant retention rate is another metric that belongs at the center of your Rental Property KPI Dashboard. High turnover costs money—there’s the cost of marketing vacant units, potential lost rental income during vacancies, and the effort required to screen and onboard new tenants. A Rental Property KPI Dashboard that highlights retention trends helps you understand whether tenant satisfaction is your limiting factor, pricing issues are driving departures, or other factors require attention. This metric directly correlates with profitability.
Return on Investment (ROI) calculations are fundamental to long-term success. Your Rental Property KPI Dashboard should present ROI both per property and across your entire portfolio. This metric considers not just rental income but also expenses, capital improvements, and property appreciation. In Kenya’s growing property market, understanding which properties are generating the best returns helps you make informed decisions about where to allocate additional capital or which underperforming assets might merit strategic repositioning.
How Technology Streamlines Performance Monitoring
Modern property management technology has revolutionized how managers monitor performance. Where previous generations relied on manual data compilation, today’s Rental Property KPI Dashboard automates data collection and analysis. Integration with rent payment systems, maintenance request platforms, and tenant communication tools means your dashboard is continuously fed with fresh data. This automation eliminates the delays that plague manual reporting processes and ensures accuracy.
The technical architecture underlying a sophisticated Rental Property KPI Dashboard enables features that were impossible just years ago. Automated alerts notify you immediately when predefined thresholds are exceeded—for example, if occupancy in any property drops below your target level, or if repair costs spike. These alerts enable rapid response to emerging problems rather than discovery of issues during monthly reviews. In a fast-moving market like Kenya’s, this responsiveness provides genuine competitive advantage.
Cloud-based Rental Property KPI Dashboard solutions offer particular advantages for multi-property managers. You can access your dashboard from anywhere—monitoring your properties while traveling between sites, reviewing reports from home after hours, or quickly checking metrics while discussing properties with potential investors. This accessibility doesn’t just improve convenience; it fundamentally changes your management approach by keeping you constantly connected to your business.
Data visualization is another technology advantage embedded in modern dashboards. Rather than presenting pages of numbers and tables, a Rental Property KPI Dashboard uses charts, graphs, and heat maps to communicate information intuitively. A single glance at your dashboard can reveal which properties are performing well and which require attention. This visual approach reduces the time required to understand complex information and makes dashboards accessible even to team members without financial analysis backgrounds.
Maximizing Profitability Through Dashboard Insights
Profitability improvement doesn’t happen through insight alone—it requires actionable intelligence and the discipline to act on the data your Rental Property KPI Dashboard provides. Consider pricing optimization. If your dashboard reveals that certain properties consistently maintain 95% occupancy while others struggle at 70%, this disparity likely indicates pricing misalignment. Perhaps the fully-occupied property is underpriced relative to market rates, or the struggling property is overpriced or lacks competitive amenities. Armed with this insight from your Rental Property KPI Dashboard, you can adjust prices strategically, potentially increasing revenue without losing tenants.
Expense management is equally important. Your Rental Property KPI Dashboard might reveal that one property consistently has higher utilities costs than comparable properties in the same area. This could indicate maintenance issues, inefficient appliances, or poor building envelope characteristics. Once identified through your dashboard, you can investigate and implement targeted improvements. Similarly, if maintenance costs spike in specific months (perhaps due to weather-related issues), your Rental Property KPI Dashboard enables you to budget accurately and prepare for these predictable expenses.
Vacancy management and turnaround efficiency directly impact profitability. A Rental Property KPI Dashboard that tracks average vacancy duration and turnaround time between tenants helps you identify opportunities for improvement. If your dashboard shows that vacant units sit for an average of three weeks before being re-rented, you might investigate whether your marketing approach could be improved, whether your property qualifies for premium pricing if upgraded, or whether pricing adjustments could attract tenants faster.
Perhaps most importantly, your Rental Property KPI Dashboard enables portfolio optimization decisions. Over time, every property manager faces questions about which properties to retain, which to upgrade, and which to sell. A comprehensive Rental Property KPI Dashboard provides the historical data and performance insights needed to make these strategic decisions with confidence rather than guesswork. When you can demonstrate with clear data that one property significantly underperforms in ROI compared to market benchmarks, the case for strategic action becomes obvious.
IMPLEMENTATION, BENEFITS, AND STRATEGIC ADVANTAGE
Benefits for Property Managers and Landlords
Property managers benefit from a Rental Property KPI Dashboard in ways that directly impact their professional effectiveness and career advancement. For managers overseeing portfolios for others, the dashboard provides the evidence needed to demonstrate competence and value. When you can show property owners monthly reports generated from your Rental Property KPI Dashboard demonstrating occupancy improvements, cost reductions, or revenue increases, you’re building the case for expanded responsibilities and management of additional properties. This dashboard becomes your professional portfolio, demonstrating your strategic management capabilities.
Time savings represent another crucial benefit. The hours typically spent manually compiling data, creating reports, and analyzing information manually can be redirected toward strategic activities. When your Rental Property KPI Dashboard automatically generates reports, property managers gain hours each week that can be invested in tenant relationship building, property inspections, vendor negotiations, or professional development. In the fast-paced Kenyan market, these reclaimed hours provide genuine competitive advantage.
For landlords and property owners, a Rental Property KPI Dashboard provides the transparency and insight needed to confidently manage their investments. Landlords using professional property managers often express concern about performance—is my property being managed effectively? Am I getting the best possible returns? A Rental Property KPI Dashboard answers these questions with objective data. Property owners can access their own dashboard to monitor performance, understand why decisions are made, and discuss property strategy with their managers from a position of informed understanding.
The psychological benefit of visibility should not be underestimated. Property ownership, particularly when professionally managed, can feel like navigating in the dark. A Rental Property KPI Dashboard illuminates that darkness, replacing uncertainty with data. Whether the data shows excellent performance (which is reassuring) or identifies concerning trends (which enables action), knowledge is preferable to uncertainty. This transparency builds confidence in management and in investment decisions.
Improving Efficiency Through Automation and Analytics
Automation embedded within a comprehensive Rental Property KPI Dashboard eliminates manual processes that consume time and introduce error. Instead of managers manually logging maintenance requests into spreadsheets, the request itself automatically feeds the dashboard. Instead of manually calculating occupancy rates from lease documents, the system calculates this automatically as leases are entered. This systematic automation doesn’t just save time—it ensures consistency and accuracy across all properties and all time periods.
Analytics functionality within your Rental Property KPI Dashboard moves beyond simply reporting what happened to providing insight into why it happened and what it means. Advanced dashboards use statistical analysis and trend identification to reveal patterns humans might miss. Perhaps maintenance costs are higher in properties where tenants waited longer after initial requests—suggesting that faster service might actually reduce costs. Perhaps rental income collection rates improve with specific communication approaches—suggesting best practices that should be standardized.
Workflow optimization becomes possible when your Rental Property KPI Dashboard reveals bottlenecks. If your dashboard shows that maintenance turnaround times are consistently high, you can trace this through the data—are requests not being communicated to vendors efficiently? Are specific vendors consistently slow? Are certain types of maintenance taking longer than they should? Once identified, these bottlenecks can be addressed systematically, improving operations across your portfolio.
Team performance management becomes more objective and fair when guided by a Rental Property KPI Dashboard. Rather than subjective assessments, performance reviews can reference specific metrics generated by the dashboard. This objectivity improves morale, enables clear goal-setting, and helps identify team members for advancement or specialization opportunities based on performance data.
Compliance, Security and Risk Management
Property management involves numerous compliance requirements—maintenance standards, tenant rights regulations, financial reporting obligations, and safety codes. A robust Rental Property KPI Dashboard helps ensure compliance by tracking metrics directly related to these requirements. Maintenance documentation, inspection records, and tenant communication logs can be integrated into your dashboard, ensuring nothing slips through the cracks. In Kenya’s increasingly regulated property sector, this compliance tracking capability is invaluable.
Security of tenant and financial data is paramount in property management. A professionally developed Rental Property KPI Dashboard incorporates security features that protect sensitive information through encryption, access controls, and audit trails. When your dashboard is cloud-based and maintained by professionals, you benefit from security infrastructure that’s typically more robust than what individual managers could implement independently. This is particularly important given Kenya’s increasing digital maturity and the heightened awareness of data security.
Risk management capabilities embedded in your Rental Property KPI Dashboard help you anticipate and mitigate problems before they become crises. When a dashboard tracks tenant communication patterns and identifies tenants who haven’t paid on time recently, it enables early intervention rather than crisis management. When it tracks maintenance issues and identifies properties with recurring problems, it enables preventive action rather than reactive repairs. This proactive approach reduces risk across multiple dimensions—financial, operational, and reputational.
Why RentalDesk’s Rental Property KPI Dashboard is the Ideal Solution
RentalDesk understands the specific challenges facing property managers in Kenya. The platform’s Rental Property KPI Dashboard is designed not as a generic tool but as a solution specifically built for property management operations in the East African context. This focus manifests in numerous ways—the dashboard includes metrics particularly relevant to Kenya’s market, currencies are displayed in Kenyan Shillings, and the interface reflects workflows familiar to Kenyan property managers.
The Rental Property KPI Dashboard offered through RentalDesk integrates seamlessly with the broader property management suite. Your rental agreements, maintenance requests, tenant communications, and financial records all feed directly into your dashboard. This integration eliminates the manual data entry that plagues systems where different components don’t communicate. When everything works together within a unified platform, creating your Rental Property KPI Dashboard requires no additional effort—the data is already there, organized and ready to visualize.
Customization capabilities make RentalDesk’s Rental Property KPI Dashboard adaptable to diverse property management operations. Whether you’re managing residential apartments, commercial spaces, mixed-use properties, or specialized assets, your dashboard can be configured to highlight the metrics most important to your specific business. This flexibility ensures your Rental Property KPI Dashboard serves your actual needs rather than forcing you to work around a tool designed for generic scenarios.
Support and training matter significantly when implementing a Rental Property KPI Dashboard. RentalDesk provides comprehensive onboarding, documentation, and responsive customer support. You’re not left to puzzle out how to effectively use your dashboard—the team helps you establish metrics aligned with your business objectives, trains your staff on interpretation and use, and provides ongoing support as your needs evolve.
Future Trends in Property Management Analytics
The evolution of property management technology continues rapidly. Artificial intelligence and machine learning capabilities are increasingly being incorporated into sophisticated Rental Property KPI Dashboards. These technologies enable predictive analytics—forecasting tenant churn, anticipating maintenance needs, predicting optimal pricing. Rather than analyzing what has happened, your Rental Property KPI Dashboard will increasingly help you anticipate what will happen, enabling even more proactive management.
Integration with smart building technologies represents another trend reshaping property management. As properties increasingly incorporate IoT devices, smart meters, and automated systems, these data sources will naturally integrate with your Rental Property KPI Dashboard. Imagine your dashboard automatically tracking not just water and electricity usage but analyzing consumption patterns to identify leaks or inefficiencies. This integration of building intelligence with business intelligence will transform how properties are managed.
Mobile-first design is becoming standard in property management tools. Your Rental Property KPI Dashboard will increasingly be optimized for mobile devices, enabling full functionality from your phone or tablet. This means you can check critical metrics, respond to alerts, and access reports while away from the office. For property managers who spend significant time visiting properties or meeting with tenants, this mobility is transformative.
Getting Started with Your Rental Property KPI Dashboard
Implementing a Rental Property KPI Dashboard doesn’t require massive upfront investment or complex system overhauls. Start by identifying the metrics most critical to your business. What decisions do you need to make regularly? What information would improve those decisions? Your initial Rental Property KPI Dashboard might track just five to ten key metrics, with additional metrics added as your confidence and sophistication grow.
Choose a platform specifically designed for property management rather than adapting generic business intelligence tools. A purpose-built Rental Property KPI Dashboard like that offered through RentalDesk will be easier to implement, more intuitive to use, and will include metrics and functionality specifically relevant to property management. The time and cost savings justify the choice.
Establish baselines for your metrics before diving deep into analysis. When you first generate your Rental Property KPI Dashboard, you’ll see current performance—but without historical context, it’s difficult to know whether performance is good, improving, or declining. Plan to gather several months of dashboard data before drawing major conclusions. As historical data accumulates, trends become visible and your ability to make strategic decisions improves dramatically.
Train your team on how to interpret and use your Rental Property KPI Dashboard. Data is only valuable if people understand what it means and how to act on it. Ensure property managers, maintenance coordinators, and other staff understand which metrics matter for their roles, how to interpret what they’re seeing, and how to use insights to improve performance. This training investment pays dividends through improved operations and better decision-making throughout your organization.
